Handling data – pictograms and block graphs (two days).
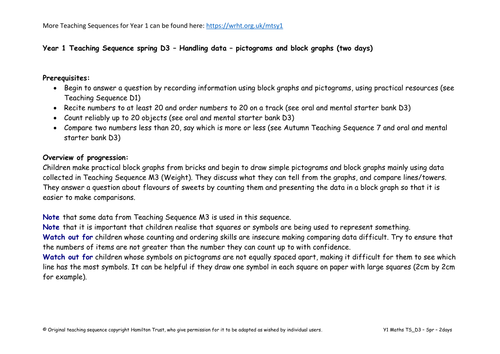
Children make practical block graphs from bricks and begin to draw simple pictograms and block graphs mainly using data collected in Teaching Sequence M3 (Weight). They discuss what they can tell from the graphs, and compare lines/towers. They answer a question about flavours of sweets by counting them and presenting the data in a block graph so that it is easier to make comparisons.
Find additional lesson plans and resources at www.hamilton-trust.org.uk.
Something went wrong, please try again later.
Some good ideas can be drawn out from this plan.
Report this resourceto let us know if it violates our terms and conditions.
Our customer service team will review your report and will be in touch.
£0.00
